
5.8 Theories of Mental Representation
Before evaluating the kinds of explanations of cognitive abilities we have seen so far, let’s do one more example from the literature. Throughout the 60s and 70s, there were many other studies like Paivio’s that invoked the concept of mental imagery as potentially necessary to explain how people were performing different kinds of tasks.
In 1973, Zenon Pylyshyn (1973) published a critique of emerging mental imagery explanation initiating a lengthy debate with Stephen Kosslyn about the form of mental representations. This debate led to several experiments trying to provide evidence in favor and/or against either position.
I will use the terms analog versus propositional to distinguish between the two theoretical ideas about mental representations. The analog representation idea is that perceptual experiences and mental imagery experiences are represented in somewhat similar (analogous) formats. This could imply that perception is involved somehow in mental imagery, and that mental imagery might behave similarly to perception in some circumstances. Sometimes the analog theory is called the “pictorial” theory (or a theory of spatial representations), to evoke the simple idea that perceiving and imagining an image might rely on closely related mental representations. (Of course, these theories apply to other forms of mental imagery too, e.g., auditory or olfactory or whatever, so “analog” can be a more general term.)
Alternatively, the propositional representation assumption is that mental representations are fundamentally different from our perceptual (and imagery) experiences. A propositional system uses symbols and rules for their combination and recombination to describe mental representations. We’ll see a more concrete example shortly, but propositional systems aren’t too different from using words to describe an image. A paragraph of words to describe an image involves word symbols and rules for putting words together in order. A well-written paragraph can do an OK job of representing a visual scene. And, it is hopefully clear enough that using words to describe an image involves a very different kind of representation than, say, taking a picture of the image. On this view, people don’t actually have something like pictures in their mind. Instead, cognitive abilities are controlled by propositional knowledge and representation systems, and the mental experience of “imagery” is more a byproduct of those representations.
The analog and propositional ideas about cognitive representation are two very different takes on the fabric of cognition. Is our cognition running on perception-like representations of our experiences with the world? Or, is our cognition running on abstract propositional codes that are qualitatively different from perception? Do these alternative ideas about mental representation make different predictions? If so, can the predictions be tested with experiments? To answer these questions, let’s look at an experiment using the mental chronometry technique.
Mental Chronometry
In 1978, Stephen Kosslyn and colleagues (Kosslyn et al., 1978) reported some clever experiments on scanning of mental images. Here’s the quick and dirty version. Imagine a map of the USA, now zoom in on New York City and imagine a little black dot hovering over the city. Whenever you are ready, zoom that little black dot all the way over to Los Angeles. How long did it take you to mentally scan across your mental image of the map? Mental chronometry refers to measuring how long it takes to perform mental operations like scanning a mental image.
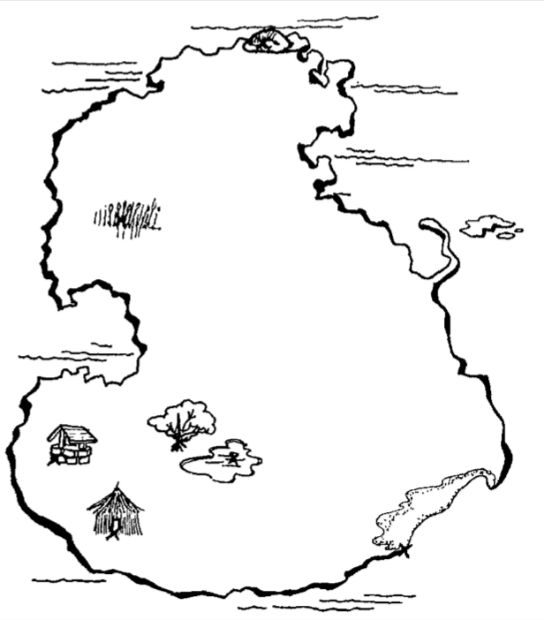
Instead of a map of the USA, participants were shown a map sort of like that in the Figure to the left, and given practice mentally imaging the map and drawing it from memory until they could reproduce it very accurately. The map was taken away and participants were asked to mentally image the map in their mind’s eye. Then, the main task began. On each trial, the participant was asked to focus on one of the depicted locations on their mental image of the map (by imagining a black dot on top of it) and then mentally scan to a different location by moving their imagined black dot to the new location. For example, you might focus on the shark in the water and then scan to the pirate ship (a longer distance); or focus on the mountains and scan to the treasure chest (a shorter distance). Importantly, the researchers measured the time taken to make each scan. The empirical question was whether the amount of time to mentally scan (their dependent variable) from one imagined location to another would depend on the distance between the imagined locations (their independent variable).
Before we look at the actual data, let’s consider three ways the experiment could have turned out. First, let’s assume that people can scan between different locations immediately without taking any time at all, I will call this the “no-time” hypothesis. Second, let’s assume that people will take some random amount of time to scan between the locations, the “random-time” hypothesis. And third, let’s assume that people’s scanning times will increase with the distance between the imagined locations, the “distance-time” hypothesis. Each of the these hypotheses makes a different prediction about how the results might turn out. Consider the three graphs below, showing how the results could have turned out according to each hypothesis:
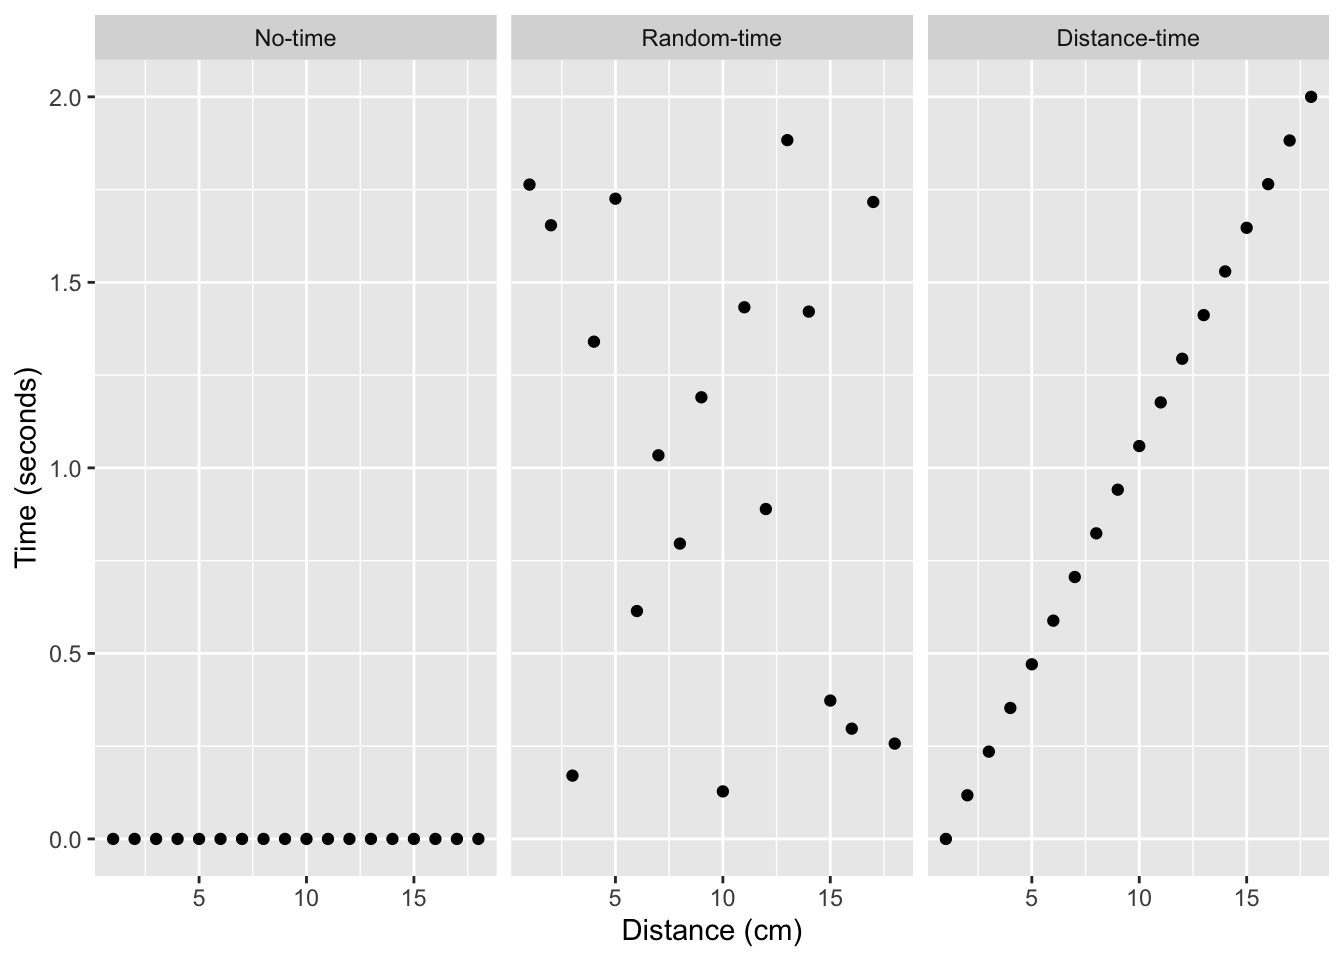
Each of the panels shows a scatter plot of possible results. The y-axis (vertical axis) represents amount of time in seconds and ranges from zero to two seconds. Dots that are near the bottom of the plot represent shorter scanning times, and dots closer to the top represent longer scanning times. The x-axis (horizontal axis) represents the distance between locations in centimeters on the real map that participants saw before they had to imagine it. Dots closer to the left of a plot represent scanning times between locations that were close together, and dots closer to the right side represent scanning times between locations that were far apart.
The “no-time” plot shows all of the dots in a line at the bottom, which represents 0 seconds. This is what would happen if people could instantaneously scan from any location to any other location. Even though some locations would be closer together or further apart (represented by the fact that there are dots that go all the way from 1 cm to 15 cm), all of the scanning times would be 0.
The “random-time” plot shows dots spread about randomly. This is what would happen if people do take different amounts of time to scan between locations, but the amount of time would be unpredictable and would not depend on the distance between the imagined locations.
Finally, the “distance-time” plot shows dots in a tilted line (going from the bottom left to the top right) showing a positive relationship or correlation between distance and time. This is what could happen if the distance between imagined locations influences scanning time in a systematic way. Specifically, this graph shows a linear relationship. As the distance between locations increases, so does scanning time. Shorter distances take less time, and longer distances take more time.
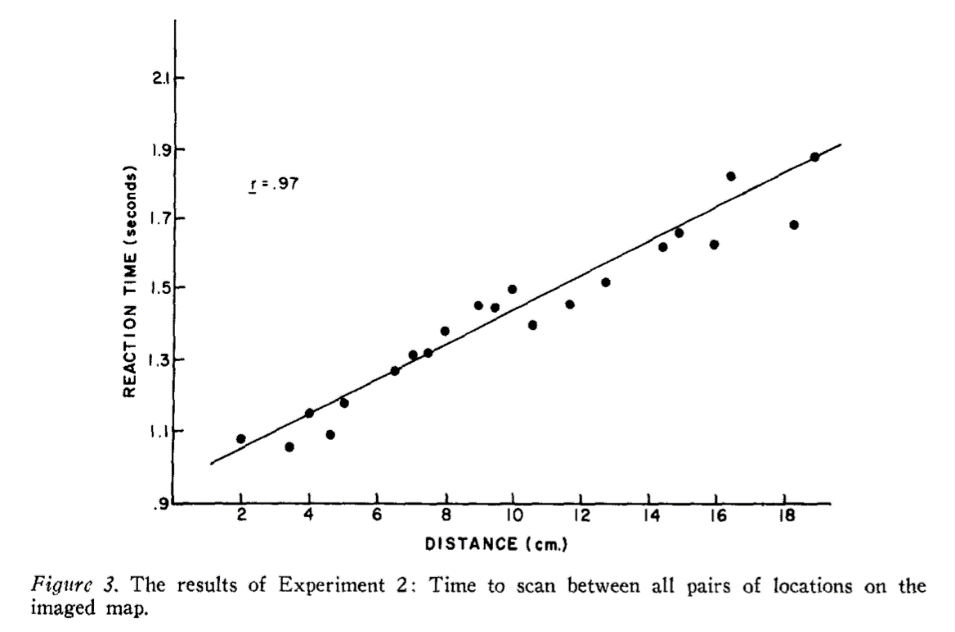
What were the results of the study? Did they look like any of the hypothetical results that we just discussed? The original results are shown to the left: the dots represent average scanning times between specific locations for all of the participants, and they mostly fall on the straight line sloping up, most similar to the hypothetical “distance-time” results. The data points are a little bit noisy, and they don’t fall precisely on the line every time, so there is a bit of randomness or variability in mental scanning time too. But overall, people appear to take longer to scan between imagined locations on the map as the distance between the locations increases (a positive correlation). Interestingly, similar mental scanning results have been found in auditory imagery for songs (e.g., Halpern, 1988).
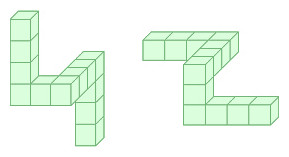
Now let’s look at another experiment using the mental chronometry technique published in the prestigious journal Science (Shepard & Metzler, 1971). This influential experiment has been called mental rotation. In this study, Participants were asked to decide whether displays (like the sample stimuli to the right) had the same geometric shapes (or not). Some of these pairs were the same but rotated to various degrees away from each other. On average, reaction times were proportional to degree of rotation. More specifically, as the degree of angular disparity increases from 0 degrees to 180 degrees, reaction times tend to increase. The explanation for this was that at least sometimes, people can mentally “rotate” images in three-dimensional space as easily as two-dimensional space; in essence, mental images are “mental sculptures” and are treated as having distance, height, etc. The big picture of these studies is that they offer a clever way to provide evidence that we do something like (visual) mental imagery in our minds.
Mental Rotation Example
Please go to the following link just below (by clicking) to participate in a short mental rotation task. When you are done with the task, you can click the button to view your data. Afterward, answer the questions below.
http://www.psytoolkit.org/experiment-library/experiment_mentalrotation.html
- Identify the independent variable.
- Identify the dependent variable.
- What do you think explains difference in your reaction time across trials?
Before considering what these results could mean for theories of mental representation, let’s note that these studies advanced how mental imagery could be investigated using more objective behavioral measures (a goal of behaviorism). In this case, the measurement of time to make a mental scan was directly observable. Although directly observable measures of behavior have many desirable properties, including the possibility that multiple observers can mutually confirm and reach consensus on what they are observing, there are also big limitations when it comes to cognition.
The biggest limitation is that direct measures of behavior are not direct measures of cognitive processes. The assumption is that cognitive processes are involved in producing the behavior in question, and that measures of behavior therefore indirectly reflect the underlying mechanisms of the mind causing the behavior. So, when someone measures “mental scanning time,” we are only measuring the time associated with whatever happened during “mental scanning.” The measure of time does not directly show if a mental image is like a picture or a proposition. Instead, a common strategy in cognitive research is to theorize about how cognitive processes might work and attempt to explain how those cognitive processes would result in the observable measures of behavior (while ruling out other possible explanations).
Explaining Mental Scanning & Mental Rotation Times
Let’s assume that the Kosslyn et al. (1978) results can be trusted as a fact, and that when people scan a mental image it really does take longer to scan across longer than shorter distances in the mental image. What does this factoid tell us about the nature of mental representation? Perhaps a better question is, how are factoids like this one used in cognitive research to generate knowledge about cognitive processes?
One strategy involves inventing theories and hypotheses about cognition, and then evaluating whether or not they can predict, describe, and/or explain the patterns of measurements found by experiment. If a theory can explain a finding maybe it is correct. If a theory can not explain a finding, maybe it is wrong and should be discarded. Over time the process of theory building and testing would lead to a great many discarded theories that couldn’t explain the findings, and what would be left could be plausible working theories that do a pretty good job explaining the findings. This characterization of how the scientific method incrementally hones in on better explanations connects with issues in the philosophy of science (e.g., Popper, 1959).
Let’s finish this section by returning to the distinction between analog and propositional mental representations, and ask whether the pattern of data is consistent or inconsistent with either of those ideas.
An Analog (or Pictorial) Explanation of Scanning Time
Are the findings consistent with the assumption that people have picture-like mental representations of visual images? I don’t think this question can be answered without first speculating more about how analog representations might work, and how they could lead to the results reported by Kosslyn et al. Here’s a simple metaphorical elaboration. I could propose that mental imagery for visual images is like perception for visual scenes, and that because of this relationship, mental imagery should behave in similar ways to visual perception. For example, objects in visual scenes have spatial distances between them, and by analogy mental images of scenes should preserve the spatial distances between imaginary objects. When looking from one object to another in the real world, it can takes time to move your eyes, and the amount of time naturally depends on how far the eyes need to move. If the metaphor holds, it is possible that mentally scanning an image will behave in the same way. So, my answer is yes. The findings could be consistent with the analog mental representation assumption, but only if I created a story that established how this assumption would work.
A Propositional Explanation of Scanning Time
Let’s ask whether the results are consistent with the propositional assumption about mental representations. Pylyshyn argued that Kosslyn’s results could be explained without assuming any role for pictorial mental representations. Again, to consider the propositional assumption we need to embed it into a working hypothesis about how people use propositional knowledge. First, consider how propositions could be used to code relations between objects in the scene. I will use sentences as an example of combining abstract symbols (words) to represent relations between objects in the scene.
- The island contains objects
- The rock is on the north end of the island
- The grass is on the north-west side of the island.
- The grass is south-west of the rock
- The tree is south of the grass, in the southwest of the island
- The well is due west of the tree
- The hut is just south of well
- The lake is close to the tree, just to the southeast
The next step is to consider how people might rely on propositions during the mental scanning task. For example, maybe the time to mentally scan between one object and another actually reflects the time it takes to activate knowledge about different objects in the propositional network. Lake and tree are close in the image, but they are also coded together in the same proposition, which could make it easier to go from the lake concept to the tree concept. Similarly, the rock is far from the tree in the image, but the way I wrote the propositions, rock is not directly coded in relation to the tree, but that relation can be established by moving through multiple propositions: the tree is south of the grass, and the grass is south-west of the rock. It might take more time to scan longer distances in the mental image because of the requirement to process multiple propositions. Additionally, proponents of a propositional theory of imagery sometimes attribute different scanning times to tacit knowledge, or the idea that we know it generally takes longer to travel farther distances and we apply such expectations to scanning tasks.
In evaluating these theories of imagery, there may not be a definitive answer regarding whether we rely more on propositional representations or analogue (spatial) representations for our imagery abilities. In fact, the two may not be mutually exclusive, and it’s possible we utilize more of a “hybrid” system in which it is advantageous to use one approach or another depending on context.
Perceptual experiences and mental imagery experiences are represented in somewhat similar (analogous) formats such that the two processes may be linked.
Similar to the idea of analog representations of mental imagery. Suggests mental images are spatially mapped out.
Hypothetical entities that are presumed to stand for a perception, thought, memory, or the like during cognitive operations.
The scientific study of cognitive processing speed.
The outcome variable a researcher measures but does not manipulate in an experiment.
The variable a researcher manipulates and controls in an experiment.
An association between two variables that when subjected to regression analysis and plotted on a graph, forms a straight line. The direction and rate of change in one variable are constant with respect to changes in the other variable.
Variables move in the same direction; as one variable increases so does the other, and conversely, when one variable decreases so does the other.
The ability to mentally manipulate stimuli some degree clockwise or counterclockwise from their normal orientations.
An approach to psychology, formulated in 1913 by John B. Watson, based on the study of objective, observable facts rather than subjective, qualitative processes, such as feelings, motives, and consciousness. To make psychology a naturalistic science, Watson proposed to limit it to quantitative events, such as stimulus–response relationships, effects of conditioning, physiological processes, and a study of human and animal behavior, all of which can best be investigated through laboratory experiments that yield objective measures under controlled conditions. Historically, behaviorists held that mind was not a proper topic for scientific study since mental events are subjective and not independently verifiable.
In the context of imagery, the idea that we have knowledge of the world stored without awareness and we apply such knowledge to our expectations of how we manipulate and scan mental representations.
