
2.2 Research Methodology Refresher
Note: I refer to this section as a “refresher” because it assumes some prior knowledge on research methodology and may not go in-depth or elaborate on the topic. If you are finding that this content is not familiar to you, I encourage you to explore this OpenStax Psychology 2e Chapter and/or this Noba chapter more fully.
The Scientific Method and Research Cycle
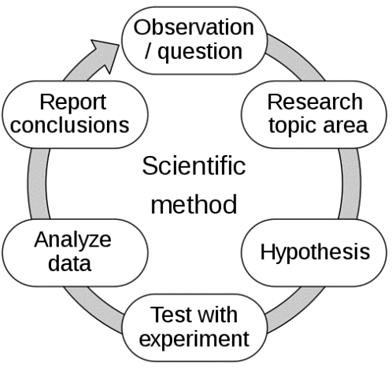
The scientific method is an empirical method of knowledge acquisition. It relies on observation and experimentation to support declarations regarding human behavior and mental processes. To apply such a method in psychology, we often represent it in the form of a research cycle (right) because the outputs of a research project can fuel the inputs of the next project. In general, the process of generating knowledge from a research cycle is incremental and involves many iterations, repetitions, and revisions.
- A researcher today might begin with an observation–like, some food tastes delicious and other food tastes repulsive…I wonder why…– or a question– like, how can a person learn to read faster? These observations and questions set the general topic for a research project.
- Prior research can help you understand the current state of knowledge about a question. For example, if you were interested in the question, “Is it possible to learn how to improve my reading speed?,” then it would be especially useful to read the existing literature on this question.
- After a researcher has familiarized themselves with the existing literature, they may come up with hypotheses, or predictions with testable implications that can be measured by an experiment. For example, a general hypothesis could be that vision-based reading speed depends on visual processing speed.
- Next, the hypothesis is put to a test with an experiment. The purpose of the experiment is to create a controlled situation where specific variables of interest can be manipulated to determine whether they influence the measurements. For example, a researcher might present words in different visual formats that may be processed more quickly or slower by the visual system. For example, some words could be presented in bold, and other words could be presented in italics. In this case, the manipulated variable is the visual format of the word, which could be bold or italic. The researcher may present words written in both visual formats to participants, and then use an apparatus to measure how long it takes them to read words in each format.
- The next stage in the cycle is to analyze the data and determine whether the manipulations had any influences. For example, if visual format reliably influences visual processing and reading speed, then the data may show differences in reading speeds for words presented in bold or italic formats.
- The research cycle ideally involves a community of peers, so the final stage of a research project is to report conclusions, or otherwise communicate the findings/results of your research. This is typically done by writing up a research report and submitting it for peer- review to a journal. The peer-review process can help identify areas of improvement that the researcher may address in a revision.
The research cycle can be used to test claims, which can lead researchers to discover new facts and create new theories (i.e., a cyclical process). For example, the above researcher might find that presenting words in bold or italics does not change reading speed very much. This could inspire another researcher to manipulate the visual form of words in more extreme ways, which could help create new “reading-speed” optimized fonts, or fonts that are “easier” on the eyes, or that help people with dyslexia read more fluently.
Correlations
Many hypotheses and research designs are rooted in assessing whether two variables (changeable factors/behaviors/abilities/etc.) are related in some way. When we identify such a relationship among 2 or more variables, we say that they are correlated; as one variable changes, the other also changes in a predictable way. We often categorize correlations based on the “sameness” of direction of change:
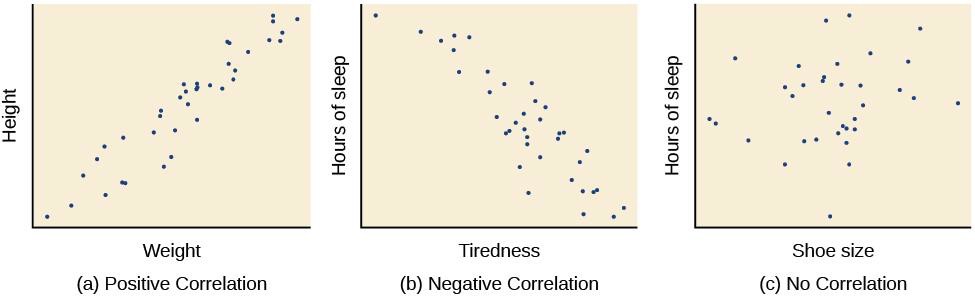
- A positive correlation means that the variables move in the same direction. Put another way, it means that as one variable increases so does the other, and conversely, when one variable decreases so does the other.
- A negative correlation means that the variables move in opposite directions. If two variables are negatively correlated, a decrease in one variable is associated with an increase in the other and vice versa.
Examples of scatterplots representing different correlations can be found below.

A common saying in psychology is that “correlation does not equal causation.” Learning that two variables are connected can be useful information on its own, but we must be careful about the conclusions we draw when observing such a connection. Let’s take one of my favorite examples of a positive correlation:
“As ice cream sales increase, homicide rates increase.”
As you probably quickly realize, without more information, we are left with several questions. Notably:
- Is ice cream making people murder-y?
- Is the act of murder making people crave ice cream?
- Is there something else entirely that can explain this relationship?
In this case, our variables (ice cream sales and homicide rates) are most likely being influenced by a third factor: outside temperature. As the outside temperature increases, it fuels both increasing ice cream sales AND irritability and aggression in humans, leading to higher rates of homicide.
Experimental and Quasi-Experimental Design
If we want to move beyond identifying correlations to inferring cause and effect, we need to utilize experimental design. In experiments, researchers manipulate, or cause changes, in one variable (what we will call an Independent Variable) and observe or measure any impact of those changes on another variable (known as the Dependent Variable).

Let’s say I want to determine if musical training has an impact on math ability in children based on the mathematical nature of musical structure. I could set up an experiment where I manipulate musical training experience (as our independent variable) to see if different types or amounts cause changes in children’s math abilities (our dependent variable). Ultimately, many experiments are still assessing correlations, but they allow for more confidence in inferring causality. Some notable features and necessities that allow us to do this:
- Operational Definitions: Specific definitions of variables that make them measurable, quantifiable, and/or categorizable. To take an idea from a theory to a testable hypothesis, we need to be clear and consistent in how we define and measure our variables of interest. In the above example, we have choices about how we define “musical training” (e.g., type of instrument, hours of practice, schedule of practice, etc.) and how we measure/define “math ability” (e.g., algebra, calculus, multiple-choice test vs. written, etc.) This consistency in definitions and measurements is vital establishing any sort of “cause and effect” relationship and helps eliminate confounding variables, or possible influencing factors that differ systematically between conditions.
- Random Assignment: Participants do not pick which condition they experience; the experimenter assigns them to a condition using random methods. In our example above, participants would not choose what type of musical training experience they have, but rather the experimenter would assign them to an experience. In this way, if we have a large enough sample size (e.g., enough participants included in our study), then variations across people that might influence the results should “wash out” across conditions.
- Generalizability: Building on the previous point, we want to make sure that our results with our participants “generalize” to the broader population about which we would like to know. The term generalize here is about how representative our findings from the study are to the rest of the people we are curious about. Typically, by utilizing random assignment and using larger samples of participants, we can be more confident in the generalizability of our findings.
Within this framework, there are many options regarding how you create variables, structure experiments, etc. Notably, there are times we want to measure the effects of variables that are hard to randomly assign, whether for logistical or ethical reasons. For example, in my own research on the effects of long-term music and language experience on mental processes like auditory processing or cognitive inhibition, long-term experience can be hard to randomly assign to participants. Rather than recruiting new parents and saying, “your baby needs to take piano lessons for 20 years” or “you have to raise your child to be bilingual in English and Chinese for the rest their lives,” it is much easier to recruit participants who already have these experiences.
In the above example, random assignment is not being utilized so we have more of a quasi- experimental design. We treat the long-term experience as an independent variable to determine its effects on another variable, but since we don’t randomly assign participants to the conditions, it allows for more possible confounding variables to creep in and we must be more cautious about inferring “causality.”
Below, find a video from SciShow Psych offering a quick summary of several of the above- mentioned topics and how they fit into the scientific method.
How We Study the Brain
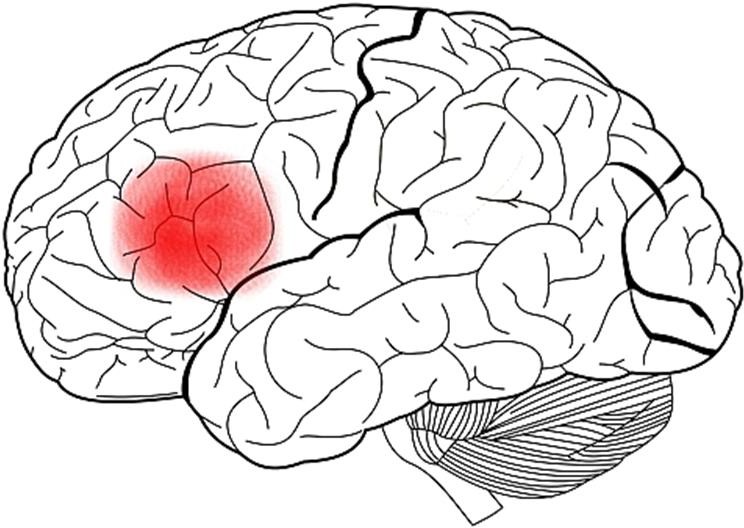
The brain is difficult to study because it is housed inside the thick bone of the skull. What’s more, it is difficult to access the brain without hurting or killing the owner of the brain. As a result, many of the earliest studies of the brain (and indeed this is still true today) focused on unfortunate people who happened to have damage to a particular area of their brain. For instance,
in the 1880s a surgeon named Paul Broca conducted an autopsy on a former patient who had lost his powers of speech. Examining his patient’s brain, Broca identified a damaged area—now called the “Broca’s Area”—on the left side of the brain (see the image below) (AAAS, 1880). Over the years, many researchers have gained insights into the function of specific brain regions from these types of patients.
An alternative to examining the brains or behaviors of humans with brain damage or surgical lesions can be found in the instance of animals. Some researchers examine the brains of other animals such as rats, dogs, and monkeys. Although animal brains differ from humans in size and structure, there are many similarities. The use of animals for study can yield important insights into human brain function.
In modern times, however, we do not have to exclusively rely on the study of people with brain lesions. Advances in technology have led to ever more sophisticated imaging techniques. Just as X-ray technology allows us to peer inside the body, neuroimaging techniques allow us glimpses of the working brain (Raichle, 1994). Each type of imaging uses a different technique and each has its own advantages and disadvantages.
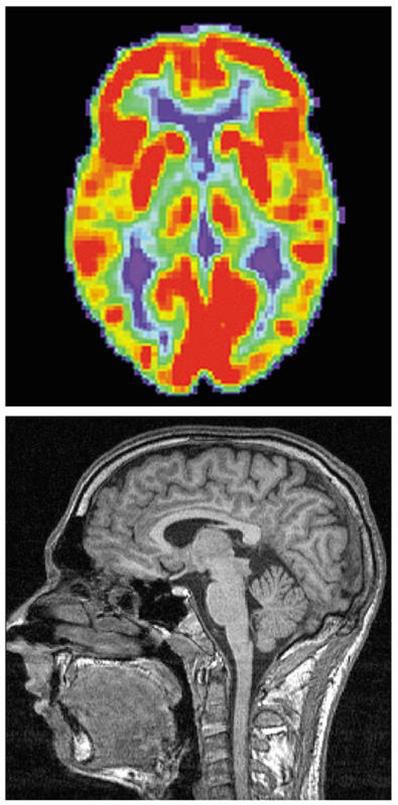
Positron Emission Tomography (PET) records metabolic activity in the brain by detecting the amount of radioactive substances, which are injected into a person’s bloodstream, the brain is consuming. This technique allows us to see how much an individual uses a particular part of the brain while at rest, or not performing a task. Another technique, known as Functional Magnetic Resonance Imaging (fMRI) relies on blood flow. This method measures changes in the levels of naturally occurring oxygen in the blood. As a brain region becomes active, it requires more oxygen. This technique measures brain activity based on this increase in oxygen level. This means fMRI does not require a foreign substance to be injected into the body. Both PET and fMRI scans have poor temporal resolution, meaning that they cannot tell us exactly when brain activity occurred. This is because it takes several seconds for blood to arrive at a portion of the brain working on a task.
One imaging technique that has better temporal resolution is Electroencephalography (EEG), which measures electrical brain activity instead of blood flow. Electrodes are placed on the scalp of participants and they are nearly instantaneous in picking up electrical activity. Because this activity could be coming from any portion of the brain, however, EEG is known to have poor spatial resolution, meaning that it is not accurate with regards to specific location.
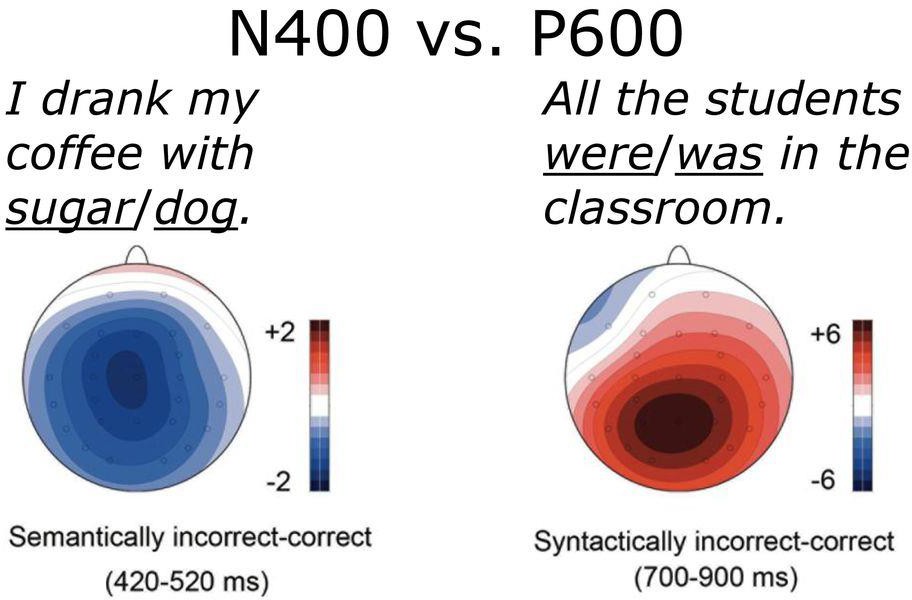
A useful distinction that EEG technology has offered us in language processing suggests that our brains treat syntactic (structural) and semantic (meaning) violations/errors as categorically different. Below, see two different Event-related Potentials (ERPS) representing each type of violation. With a grammatical/syntactic violation (“All the students was in the classroom.”), the brain is more likely to elicit a positive electric potential about 600 milliseconds after the event (now known as a P600). However, when a structurally correct but contextually inappropriate word is used (“I drank my coffee with dog.”), we see a negative potential about 400 milliseconds after the event (an N400 response).
Notably, research in music cognition suggests that these responses are not necessarily unique to language violations. In cases where listeners heard melodies with unexpected (e.g., coming from a distant musical key) musical chords inserted (thus defying the expected chord structure), we see a similar P600 ERP to that demonstrated for syntactic violations above (Patel et al., 1998).
Another technique, known as Diffuse Optical Imaging (DOI) can offer high temporal and spatial resolution. DOI works by shining infrared light into the brain. It might seem strange that light can pass through the head and brain. Light properties change as they pass through oxygenated blood and through active neurons. As a result, researchers can make inferences regarding where and when brain activity is happening.
It has often been said that the brain studies itself. This means that humans are uniquely capable of using our most sophisticated organ to understand our most sophisticated organ. Breakthroughs in the study of the brain and nervous system are among the most exciting discoveries in all of psychology. In the future, research linking neural activity to complex, real world attitudes and behavior will help us to understand human psychology and better intervene in it to help people.
An empirical method of knowledge acquisition that relies on observation and experimentation to support declarations regarding human behavior and mental processes.
Predictions with testable implications that can be measured by an experiment.
Variables move in the same direction; as one variable increases so does the other, and conversely, when one variable decreases so does the other.
Variables move in opposite directions; a decrease in one variable is associated with an increase in the other and vice versa.
A research procedure in which researchers allocate participants to experiences or groups based on the intentional manipulation of variables.
The variable a researcher manipulates and controls in an experiment.
The outcome variable a researcher measures but does not manipulate in an experiment.
Specific definitions of variables that make them measurable, quantifiable, and/or categorizable.
Possible influencing factors that differ systematically between conditions.
Participants do not pick which condition they experience; the experimenter assigns them to a condition using random methods.
How representative findings from the study are to the rest of the people we are curious about.
An experiment that does not utilize random assignment to varying experiences or conditions.
A neuroimaging technique that measures brain activity by detecting the presence of a radioactive substance in the brain that is initially injected into the bloodstream and then pulled in by active brain tissue.
Functional magnetic resonance imaging (fMRI): A neuroimaging technique that infers brain activity by measuring changes in oxygen levels in the blood.
A neuroimaging technique that measures electrical brain activity via multiple electrodes on the scalp.
A neuroimaging technique that infers brain activity by measuring changes in light as it is passed through the skull and surface of the brain.
